
Last updated:
Summary
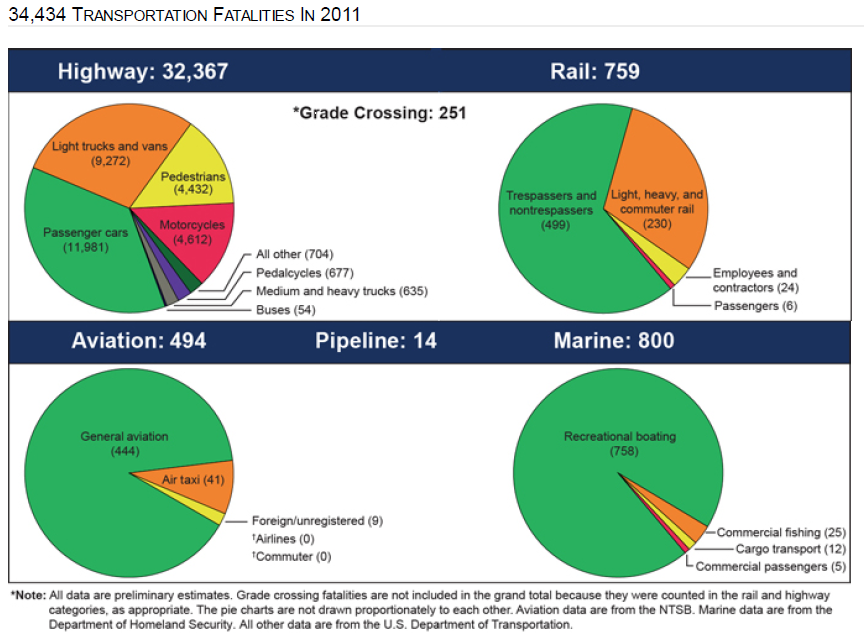
Earlier this year, the National Transportation Safety Board (NTSB) published statistics on transportation fatalities that occurred in the U.S. from 2010 to 2011. The data was separated along five different industries: highway, pipeline, rail, marine, and aviation. While there was a minor decrease in total transportation fatalities in the highway, rail and pipeline industries from 2010 to 2011, the data indicated an increase in total transportation fatalities in the marine and aviation industries during that same time. However, the statistics showed an overall decrease in the number of U.S. transportation fatalities from 2010 (35,043) to 2011 (34,434).
Highway fatalities
According to the NTSB’s data, there were 32,999 total highway fatalities in 2010 alone. The majority of these occurred among passenger cars (12,491), followed by light vans and trucks (9,782), and pedestrians (4,302). [Furthermore, medium and heavy trucks constituted 530 of the highway fatalities that occurred in the U.S. in 2010].
In 2011, there were 32,367 total highway fatalities in the U.S. Passenger cars once again constituted the majority of these incidents (11,981), with light trucks and vans (9,272) and pedestrians (4,432) following. [Furthermore, there was a significant increase in the number of fatalities associated with medium and heavy trucks in 2011 (635) when compared to 2010 (530).]
Pipeline fatalities
The NTSB statistics show that there were 22 total transportation fatalities associated with the pipeline industry in 2010 alone. This number decreased in 2011 to 14 total transportation fatalities in the pipeline industry. The majority of these incidents were associated with gas pipelines (21 fatalities in 2010 and 13 fatalities in 2011), while a small number of transportation fatalities in this grouping were associated with liquid pipelines (1 fatality in 2010 and 1 fatality in 2011).
Rail fatalities
According to the NTSB’s data, 823 total transportation fatalities occurred in the rail industry in 2010 alone. This number decreased to 759 total rail fatalities in 2011. The majority of these fatalities occurred with trespassers and nontrespassers (542 fatalities in 2010 and 499 deaths in 2011). The next significant number of fatalities in this grouping occurred among light, heavy and commuter rails (255 deaths in 2010 and 230 fatalities in 2011).
Marine fatalities
In 2010, there were 723 transportation fatalities associated with the marine industry. According to the data, this number increased significantly in 2011 to 800 fatalities. The majority of these deaths occurred in recreational boating (672 fatalities in 2010 and 758 deaths in 2011). This was followed by commercial fishing, which involved 27 transportation deaths in 2010 and 25 transportation fatalities in 2011.
Aviation fatalities
The NTSB’s statistics show that there were 476 total transportation fatalities associated with the aviation industry in 2010 alone. This number increased in 2011 to 494 total transportation deaths in the aviation industry. The majority of these fatalities occurred in general aviation (454 deaths in 2010 and 444 fatalities in 2011). [Furthermore, the data showed a significant increase in the deaths associated with the use of air taxis (17 fatalities in 2010 and 41 deaths in 2011)].
See the NTSB statistics:
http://www.ntsb.gov/data/index.html
Hurt in a trucking & 18-wheeler accidents situation?
Talk directly with John David Hart — board-certified Texas trial lawyer. Free, confidential, no fee unless we win.
Get a Free Case Review Call 817-870-2102